

Material Density To Aid High Tip Bucket & Loading Shovel Selection
The mass of a variety different ‘dry’ materials are listed below. Please note the data is supplied for guidance only, individual samples will differ and moisture content will have a marked influence. Note, kg/cu.m divided by 16.02 = lbs/cu.ft
| Material – powder, ore, solids, etc. | lbs/cu.ft | kg/cu.m. |
| Aluminum, oxide | 95 | 1522 |
| Ammonium Nitrate | 46 | 730 |
| Apples | 40 | 641 |
| Arsenic | 354 | 5671 |
| Asbestos – shredded | 20 | 320- 400 |
| Asbestos rock | 100 | 1600 |
| Ashes – wet | 46 | 730- 890 |
| Ashes – dry | 36 | 570- 650 |
| Asphalt, crushed | 45 | 721 |
| Baking powder | 45 | 721 |
| Bark, wood refuse | 15 | 240 |
| Barley | 38 | 609 |
| Beans, castor | 36 | 577 |
| Beans, cocoa | 37 | 593 |
| Beans, navy | 50 | 801 |
| Beans, soy | 45 | 721 |
| Beets | 45 | 721 |
| Bran | 16 | 256 |
| Brewers grain | 27 | 432 |
| Brick, common red | 120 | 1922 |
| Brick, fire clay | 150 | 2403 |
| Cardboard | 43 | 689 |
| Cement – clinker | 81 | 1290-1540 |
| Cement, Portland | 94 | 1506 |
| Cement, mortar | 135 | 2162 |
| Chalk, solid | 156 | 2499 |
| Chalk, fine | 70 | 1121 |
| Charcoal | 13 | 208 |
| Chocolate, powder | 40 | 641 |
| Material – powder, ore, solids, etc. | lbs/cu.ft | kg/cu.m. |
| Cinders, furnace | 57 | 913 |
| Cinders, Coal, ash | 40 | 641 |
| Clay, dry excavated | 68 | 1089 |
| Clay, wet excavated | 114 | 1826 |
| Clover seed | 48 | 769 |
| Coal, Anthracite, solid | 94 | 1506 |
| Coconut, shredded | 22 | 352 |
| Coffee, roast beans | 27 | 432 |
| Coke | 36-41 | 570- 650 |
| Concrete, Limestone with Portland | 148 | 2371 |
| Cork, solid | 15 | 240 |
| Corn, on the cob | 45 | 721 |
| Corn, grits | 42 | 673 |
| Earth, loam, dry, excavated | 78 | 1249 |
| Earth, wet, excavated | 100 | 1602 |
| Fertilizer, acid phosphate | 60 | 961 |
| Flour, wheat | 37 | 593 |
| Garbage, household rubbish | 30 | 481 |
| Glass – broken or cullet | 81-121 | 1290-1940 |
| Glass, window | 161 | 2579 |
| Glue, animal, flaked | 35 | 561 |
| Grain – Maize | 47 | 760 |
| Grain – Barley | 37 | 600 |
| Grain – Millet | 47-50 | 760- 800 |
| Grain – Wheat | 49-50 | 780- 800 |
| Gravel, loose, dry | 95 | 1522 |
| Ice, solid | 57 | 919 |
| Ice, crushed | 37 | 593 |
| Malt | 21 | 336 |
| Manure | 25 | 400 |
| Material – powder, ore, solids, etc. | lbs/cu.ft | kg/cu.m. |
| Oak, red | 44 | 705 |
| Oats | 27 | 432 |
| Oats, rolled | 19 | 304 |
| Oyster shells, ground | 53 | 849 |
| Paper, standard | 75 | 1201 |
| Peanuts, shelled | 40 | 641 |
| Peanuts, not shelled | 17 | 272 |
| Peat, dry | 25 | 400 |
| Peat, wet | 70 | 1121 |
| Plaster | 53 | 849 |
| Potash | 80 | 1281 |
| Potatoes, white | 48 | 769 |
| Rubber, manufactured | 95 | 1522 |
| Rye | 44 | 705 |
| Salt, course | 50 | 801 |
| Salt, fine | 75 | 1201 |
| Sand, dry | 100 | 1602 |
| Sand, wet | 120 | 1922 |
| Sawdust | 13 | 210 |
| Sewage, sludge | 45 | 721 |
| Slag, solid | 132 | 2114 |
| Slate, solid | 168 | 2691 |
| Snow, freshly fallen | 10 | 160 |
| Snow, compacted | 30 | 481 |
| Stone, crushed | 100 | 1602 |
| Sugar, granulated | 53 | 849 |
| Sugarbeet pulp, dry | 13 | 208 |
| Sugarbeet pulp, wet | 35 | 561 |
| Wheat | 48 | 769 |
| Wood chips – dry | 15-32 | 240- 520 |
| Wool | 82 | 1314 |
| Zinc oxide | 25 | 400 |
Reference : Density of materials www.simetric.co.uk/si_materials.htm

To download the Material Weight Volume Reference Chart please click on the button below or the image to download the PDF
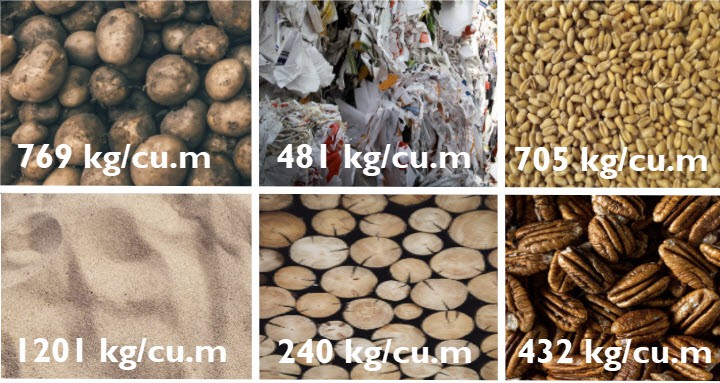

Material Densities of Dry Materials
Materials can be classified based on their physical properties such as density, colour, hardness, and texture. Density is one of the most important physical properties of materials, and it describes the amount of mass per unit volume. The density of a material can be determined by measuring its mass and volume, and it is usually expressed in grams per cubic centimeter (g/cm³) or kilograms per cubic meter (kg/m³).
Dry materials, in particular, have a wide range of densities depending on their composition and structure. Dry materials are those that have had their moisture content removed either by drying, heating, or chemical processing. These materials are commonly used in a variety of industries such as construction, agriculture, and manufacturing.
Here are some common dry materials and their densities:
- Sand: Sand is a naturally occurring granular material that consists of rock fragments, minerals, and shells. The density of sand varies depending on its composition and size. The average density of sand is around 1.6 g/cm³ or 1600 kg/m³.
- Cement: Cement is a binding material that is used in construction to hold together bricks, blocks, and other building materials. The density of cement varies depending on the type of cement and its composition. The average density of cement is around 3.15 g/cm³ or 3150 kg/m³.
- Wood: Wood is a natural composite material that is widely used in construction and furniture making. The density of wood varies depending on the species, moisture content, and age. The average density of wood is around 0.6 g/cm³ or 600 kg/m³.
- Metals: Metals are dense materials that are used in a wide range of applications such as construction, electronics, and transportation. The density of metals varies depending on the type of metal and its composition. For example, the density of iron is around 7.87 g/cm³ or 7870 kg/m³, while the density of aluminum is around 2.7 g/cm³ or 2700 kg/m³.
- Plastics: Plastics are lightweight materials that are used in a variety of applications such as packaging, electronics, and construction. The density of plastics varies depending on the type of plastic and its composition. For example, the density of polyethylene is around 0.92 g/cm³ or 920 kg/m³, while the density of polypropylene is around 0.9 g/cm³ or 900 kg/m³.
In conclusion, the density of dry materials varies depending on their composition and structure. Understanding the density of materials is important in selecting the right materials for different applications.
Please call 01440 706429
Key Technical Considerations
- Material density is typically expressed as kg/m³ or tonnes/m³
- Bucket payload = Bucket volume × Material bulk density
- Compare the calculated payload against:
- Rated Operating Capacity (ROC)
- Static tipping load
- Hydraulic lift capacity
- Axle load limits
- Remember that high tip buckets weigh more than standard buckets, reducing the available payload
Why does it matter?
Choosing a bucket based solely on its cubic capacity can easily result in overloading the machine.
A material weight and volume reference chart converts bucket volume into the expected payload weight for different materials, allowing the correct bucket size to be selected.
Using accurate density data ensures the correct bucket capacity is selected whilst maintaining safe operating limits.
Key Technical Considerations
- Moisture content can increase material weight by 20–50% or more
- Compaction during storage increases bulk density
- Frozen material is considerably heavier
- Material grading affects density:
- Fine sand packs more densely than coarse sand
- Shredded waste varies greatly depending on compression
- Operators should always regard published figures as guidance rather than absolute values
Why does it matter?
Reference charts provide average bulk densities, but actual site conditions can significantly alter the weight of every bucket load.
Understanding variations in material density helps prevent overloading and improves operational safety.
Key Technical Considerations
- Bulk density
- Moisture content
- Particle size distribution
- Air void ratio
- Material compaction
- Flow characteristics
- Percentage of fines
- Organic content
Typical Material Densities
- Woodchip: 250–450 kg/m³
- Grain: 700–850 kg/m³
- Sugar Beet: 650–850 kg/m³
- Topsoil: 1,200–1,600 kg/m³
- Wet Sand: 1,700–2,000 kg/m³
- Crushed Stone: 1,500–1,900 kg/m³
These differences mean that the same 4 m³ bucket could carry anywhere from approximately 1 tonne to over 7 tonnes, depending on the material.
Why does it matter?
Not all materials occupying the same bucket volume weigh the same. Understanding these differences prevents overloading and improves productivity.
Accurate knowledge of material properties ensures safe payload calculations and more efficient loading operations.
Key Technical Considerations
- Reduce unnecessary loading cycles
- Prevent excessive tyre, axle and drivetrain wear
- Minimise fuel consumption per tonne moved
- Avoid hydraulic overload
- Maintain machine stability during travel and tipping
- Improve loading consistency for transport vehicles
Using the correct density data often produces measurable improvements in tonnes moved per hour.
Why does it matter?
Correctly matching bucket capacity to material density allows operators to transport the maximum safe payload every cycle, increasing efficiency whilst reducing mechanical stress.
Material weight charts improve productivity by helping operators achieve the highest safe payload on every loading cycle.
Key Technical Considerations
- Update charts when processing new materials
- Reassess seasonal materials (wet versus dry conditions)
- Confirm densities after changing suppliers
- Review values following changes to processing methods
- Validate unusually high or low payloads using on-board weighing systems or calibrated weighbridges where possible
Many operators treat material density charts as living documents that are refined using actual operating data.
Why does it matter?
Material properties change over time, and relying on outdated density values can lead to incorrect bucket selection and unsafe operating conditions.
Regularly updating material density data ensures accurate payload calculations, safer operation and optimum machine performance.
